View Sale Announcement Detail

Archived news
Excerpt:
The prices of nonperforming charged-off debt have been declining for several years. By identifying several correlating factors with these prices, a few predictions can be made about what the future holds.
Post:
Issuers are taking a closer look at loan portfolios now that pricing in the consumer charge-off marketplace is on the decline. Many are adding new buyers or selling in specialized segments. In October 2015, the Federal Reserve reported that total outstanding consumer debt was roughly $3.5 trillion and in June of this year was an estimated $3.9 trillion, an 11% increase.
The breakdown for household participation in consumer debt is reported as: Credit Cards (70%), Mortgages (45%), Auto Loans (30%), and Student Loans (19%). Since its highwater mark ending in 2015, the pricing for charged-off credit card debt has been on the downtrend and is down about 32 percent. Other segments, such as student loans, auto and subprime have also declined. The one sector that has seen a recent uptick in pricing is Fintech where modest price increases seem to be following the credit tightening of portfolios that occurred in 2016.
Charge-Off Pricing Trends and Their Driving Factors
There is roughly $1.02 trillion in outstanding credit card debt and about $40 billion of that total is charged-off on an annual basis. Of that, Garnet estimates that approximately half (or $20 billion) is sold within the first year after charge-off and much of the rest sold over time or warehoused.
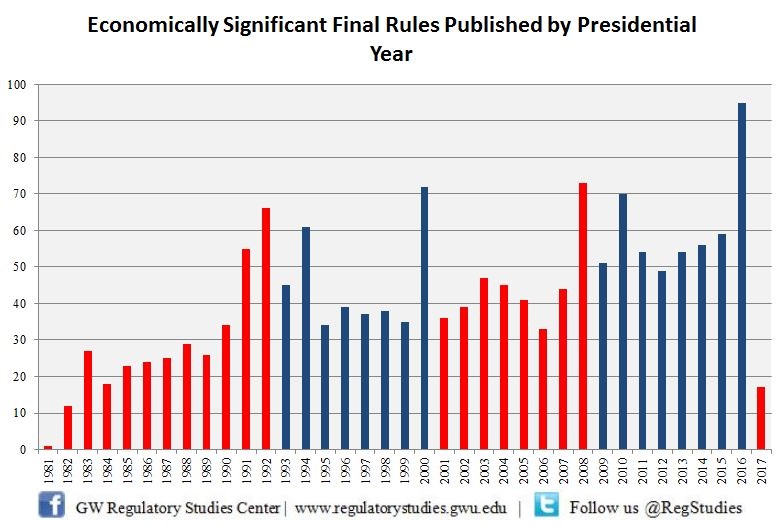
Garnet tracks pricing of several different sectors of charge-offs adding auto, student loans and DDA to the review. But the benchmark is a semi-annual review of the current price for fresh credit and charge-offs. This data has been tracked since 2001 and is reflected in Chart 1. There have been pricing fluctuations in the consumer charge-off marketplace over the past decade thanks to several economic and regulatory factors.
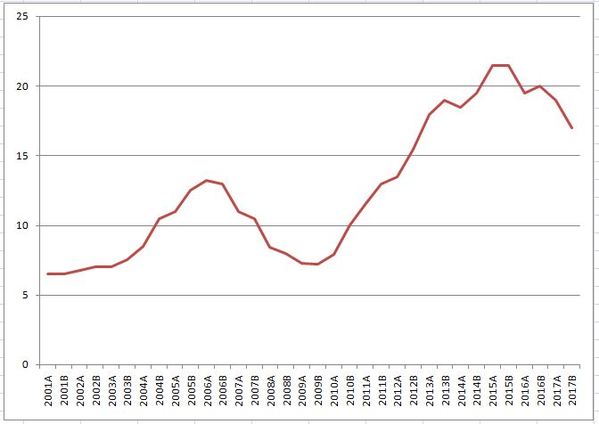 Chart 1 - Fresh charge-off pricing is currently down and continues to decline.
Between 2006 and 2008, charge-off prices fell. The reasons for this deterioration include:
Chart 1 - Fresh charge-off pricing is currently down and continues to decline.
Between 2006 and 2008, charge-off prices fell. The reasons for this deterioration include:
Once the country began emerging from the Great Recession, prices increased from 2010 to 2015. Reasons for this include:
From 2015 to the current period, prices have once again declined. This is occurring because:
How Employment and Labor Force Participation Correlates With Charge-Off Pricing
When attempting to predict charge-off pricing, it's helpful to understand how these prices correlate with some other macroeconomic factors. Garnet has tracked various macroeconomic factors since 2001, looking for correlations which can also help predict where pricing is going. According to our research, there could be correlating factors when compared with:
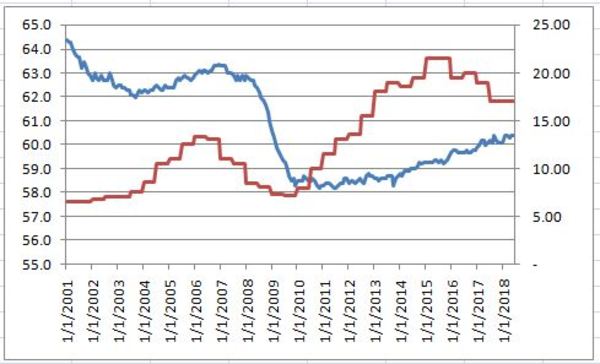
The labor force participation rate is the percentage of the total population that is available for work. In July 2018, that rate was 62.9 percent. This rate has a high negative correlation with charge-off pricing, where prices move in the opposite direction of labor force participation rates. This may not seem the case when viewing the graph but is more intuitive in the period after 2005 when the charge-off market became more efficient.
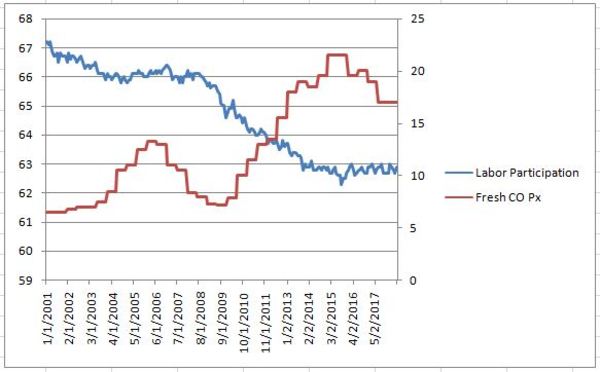 Chart 2 - The labor participation rate has a high negative correlation with pricing.
The civilian employment rate refers to the percentage of the total population who are employed, restricted to people ages 16 and older and people who are not on active duty in the Armed Forces. This rate also correlates to pricing, with a somewhat positive correlative relationship over time.
Our hypothesis is that the slow rate of increase in employment rates vs. the price increases experienced during the 2010 to 2015 timeframe have more to do with supply & demand and regulatory issues.
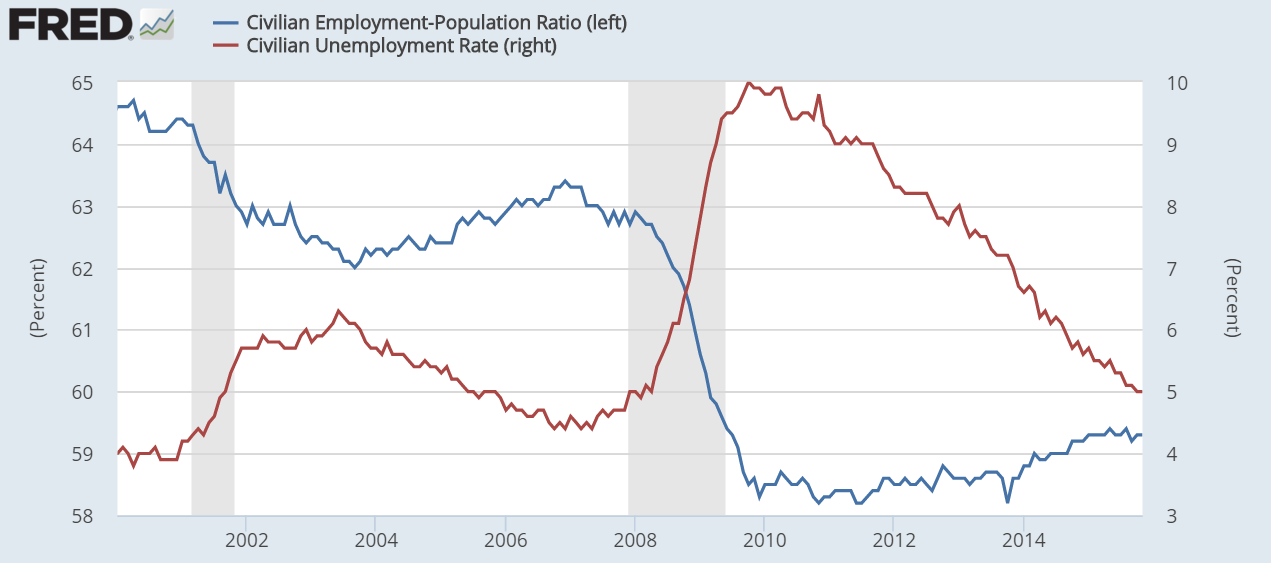
 Charts 3 & 4 - The civilian employment rate is also correlated with charge-off pricing in certain years.
Chart 4: Red: Fresh CO Px; Blue: Civilian Employment Rate.
We also looked closely at the way economic regulations impact charge-off prices. Specifically, we determined that there is a high negative correlation between charge-off pricing and the relatively high rule-making years of 2008 to 2010. It could be that this period restricted supply and lowered price short-term but improved the industry, products sold, and pricing in the long term. This correlation has faltered in recent years. Higher publishing of regulatory rules seems to depress pricing but fewer new regulations does not seem to raise prices as both sellers and buyers feel they must prepare to function in a highly regulated environment.
Source: regulatorystudies.columbian.gwu.edu
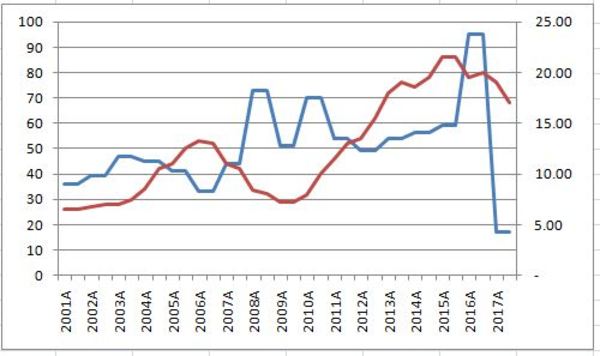 Charts 5 & 6 - There was a high negative correlation with pricing between 2008 and 2010 during periods of more economic regulation.
Chart 6: Red: Fresh CO Px; Blue: Number of New Economic Regulations.
What Does the Future Hold for Charge-Off Pricing?
The correlations may help predict the future of charge-off pricing provided the correlative factors hold up. For example, the Bureau of Labor Statistics has released labor force participation rate of participation projections for the next few years, with expectations that those rates will continue to decline. This could mean that charge-off prices will continue to drift lower in the coming years.
Other factors that drive these prices are supply and demand as well as the overall economic health in the U.S. One driver that is different than in years' past is the evolution of data technology, which will serve as the future foundation for determining collectibility and therefore pricing going forward.
Advanced analytics combined with access to an unprecedented volume of data will provide more insight into the make-up of debt portfolios as well as provide tools for regulatory compliance and greater efficiencies. Thanks to these factors, banks will continue to engage in this market as the buyers of this product will have greater capacity to spend on compliance and number crunching than the actual issuers of the credit.
Why Partnership With a Loan Sale Advisor Makes Sense
Garnet predicts stable pricing for the immediate future and prices trending lower in 2019 and beyond. Because of this, banks should consider entering into flow sales of product while the market is at favorable pricing. Because of its complexities, buying and selling loan and credit portfolios in today's market demands multiple areas of expertise.
An experienced whole loan broker has established contacts with reputable buyers and sellers, understands the interests of the parties involved, and can provide valuable pricing insights as conditions change. A qualified loan sale advisory service will ensure that the needs of their buyers are matched with the right funding sources to produce the appropriate returns and achieve short and long-term goals.
Sign up for our newsletter to receive our latest industry updates as well as information about Garnet's loan sale advisory services.
 is a set of security standards designed to ensure that ALL companies that accept, process, store or transmit credit card information maintain a secure environment.")